
Data Analysis
Data analysis is the process of obtaining a more in-depth understanding of your data and presenting your analyses in the most attractive and easy-to-use format suited to your needs. The process lends itself to providing robust evidence and intelligence to support decision making and highlights a need or demand for change.
While data analysis encompasses multiple steps and processes, it can be thought of consisting of three stages: Pre-Analysis, Analysis and Post-Analysis.
1. Pre-Analysis
This stage consists of defining the needs for data analysis, assessing the availability of data, generating or collecting required data and conducting data cleaning to ensure completeness and validity. Specific things to consider include:
Data quality
- Completeness: are all fields in your data complete? If possible, try fill any gaps, else you might not be able to use that particular field. Using consultation can be an effective way of filling gaps.
- Are all cells in a field in the same format? E.g. residents may be asked for their age in a survey, and some may have accidentally entered their entire DoB instead.
Data protection
- Does your data contain personal details about residents?
- Could the data be used to identify anyone?
- Do you need to suppress any of your results?
- When unsure, contact Data Protection!
Sourcing
- Know where & when your data is from.
- Make sure you have permission to use the data.
2. Analysis
Usually, data analysis is all about spotting patterns & trends. Depending on the content of your data, there may be different ways to analyse it, some more suitable than others. These may be:
- Temporal
- Spatial
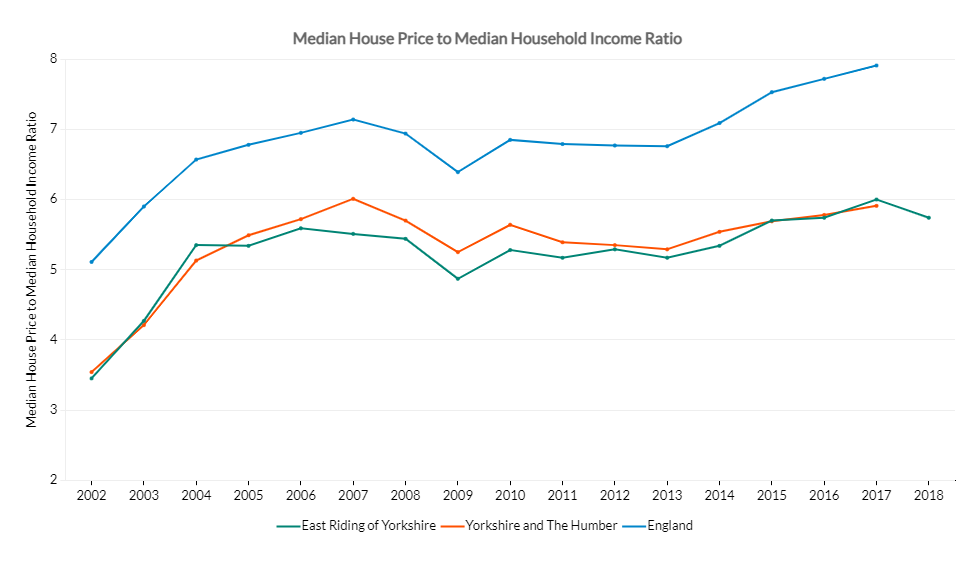
Temporal analysis is concerned with patterns in time, for example yearly changes in the projected proportion of the population aged 65 and over between 2018 and 2043. To perform temporal analysis, your data will require some sort of time/date field.
Line graphs can be particularly useful to show temporal trends, for example:
Spatial analysis compares data for different locations, for example wards in the East Riding, or postcodes in Holderness. To perform spatial analysis, your data will require some sort of location field, whether that be an address/postcode or a parish/ward/LSOA etc. Maps are usually the best way to show spatial trends, for example:

If you don’t have the ability to map your data, get in touch with us at intel-hub@eastriding.gov.uk. We can create both static (like the above) and interactive (link) maps with your data.
3. Post-Analysis
- A colleague familiar with data analysis may want lots of raw data, so that they can perform their own analysis.
- A head of service may benefit most from some stand-out figures or trends that you found during the analysis stage, rather than any raw data.
- Tables can be easy to read, but can become cumbersome when there’s a lot of data in them.
- Graphs and charts can be great visual aids, but you might have to add a line to explain how to read them properly for those who are less familiar with data/analysis.
- Both tables and maps can show spatial data, but only maps give an immediate geographical feel for where the patterns are!
Last Updated on August 2, 2024